
The ODiSI (Optical Distributed Sensor Interrogator) is a 21st century strain and temperature measurement system specifically designed to address the test challenges of 21st century advanced materials and systems. Â
The ODiSI provides more than 1000 strain or temperature measurements per meter of a single high definition fiber sensor. The high definition data can fully map the contour of strain or temperature for a structure under test.
The sensor is flexible, low-profile, requires no electrical source, and can be bonded to sharply curved surfaces, embedded withing structures, or mounted directly to electrical surfaces. Â
Two models available:
Â
Key Features
- Multichannel measurements of strain-multiplex up to 200,000 measurement locations
- Flexible, lightweight and easy to install sensors reduce time to first measurement
- Passive, corrosion resistant, dielectric, flexible sensors go where other sensors can’t – in bends, around corners, embedded inside materials
- Long sensor life – no drift or recalibration required, cycle counts >107
- Large strain range and high resolution allow for mapping of complex strain fields and large strain gradients
Applications
- Characterize strain on/in new materials and complex structures
- Profile temperature in-situ to maximize the efficiency of critical processes
- Measure two – and three – dimensional strain fields to validate FE models
- Evaluate multi-material joining
- Embed sensors within materials to create “smart parts”
The ODiSI in Action – High Definition Fiber Optic Sensing (HD-FOS)
Bonding a fiber sensor along a test article
 Up to 1000 measurements per meter of fiber
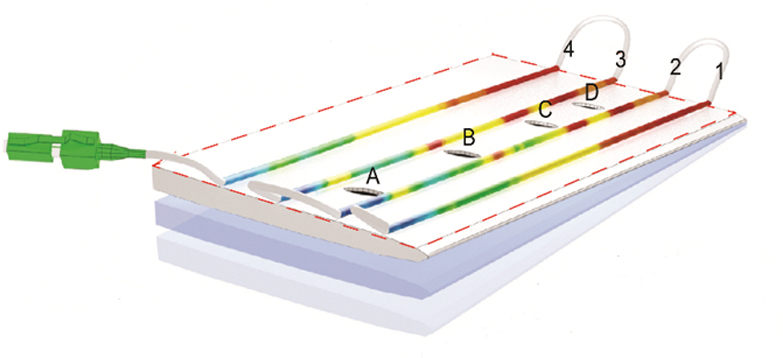
A fiber sensor constructed of unaltered fiber optic cable can be mounted on the surface of a structure or embedded within it. At left, a fiber is routed in a serpentine fashion, making four passes along a beam. Two of the passes are routed adjacent to machined holes, which are known areas of stress concentration.
Â
Strain as a function of position along the fiber
 HD-FOS to find gradients and hot spots
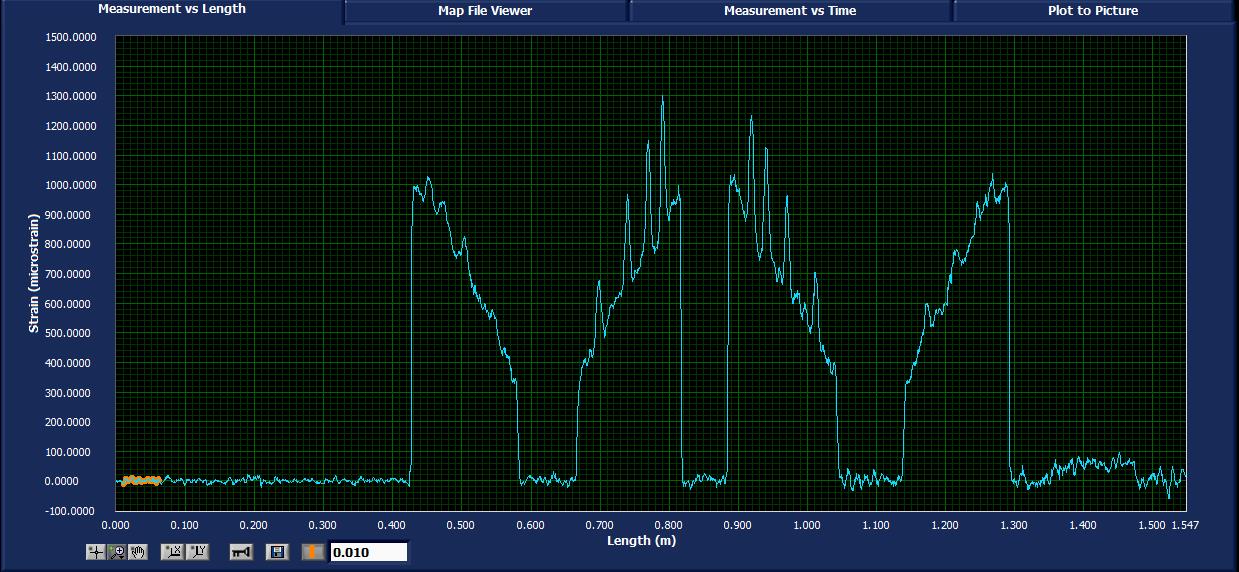
Strain (or temperature) is plotted as function of position along the sensor. This continuous line of high definition data allows engineers to eliminate the uncertainty of locating hot spots and gradients. The image at left shows the strain profile of a beam in deflection. A fiber sensor is routed making four passes along the test article. High gradients resulting from the machining are clearly visible in the center two passes.
Internal post processing allows closer inspection
 Zooming in on the critical areas
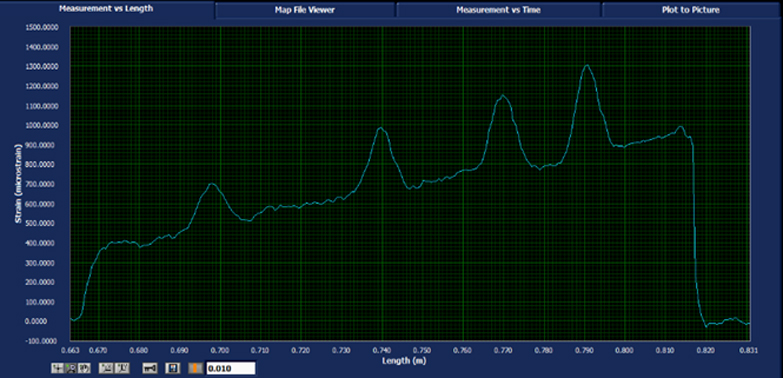
The high definition data is stored by the ODiSI and can be accessed by a separate post processing tool. This tool allows the user to zoom in on areas of high gradients. Graphs can be exported for use in test reports.
Â
Â
Â
Strain as a function of time
 Using software to define points or segments
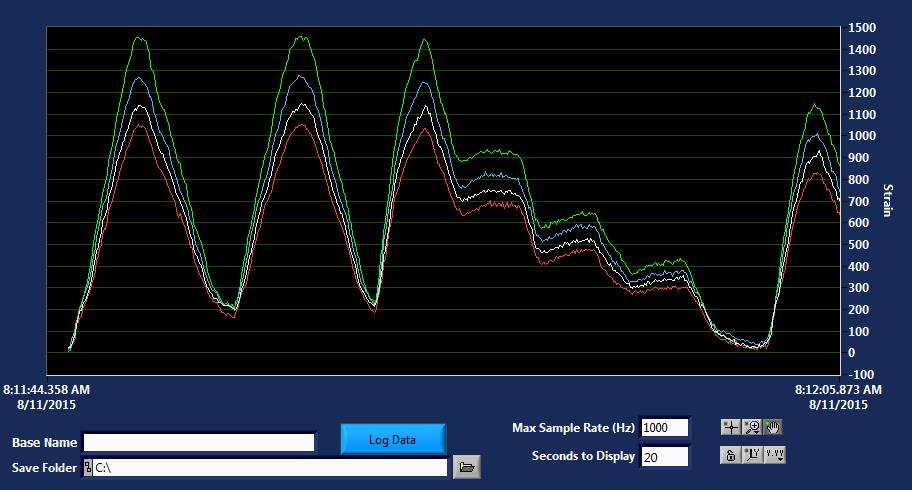
Because the sensors used with HD-FOS do not require fiber Bragg gratings the ODiSI user software can be used to redefine both gage length and gage location. Specific points or even segments within the sensor can be defined and strain (or temperature) of those points plotted versus time.
Â
Â
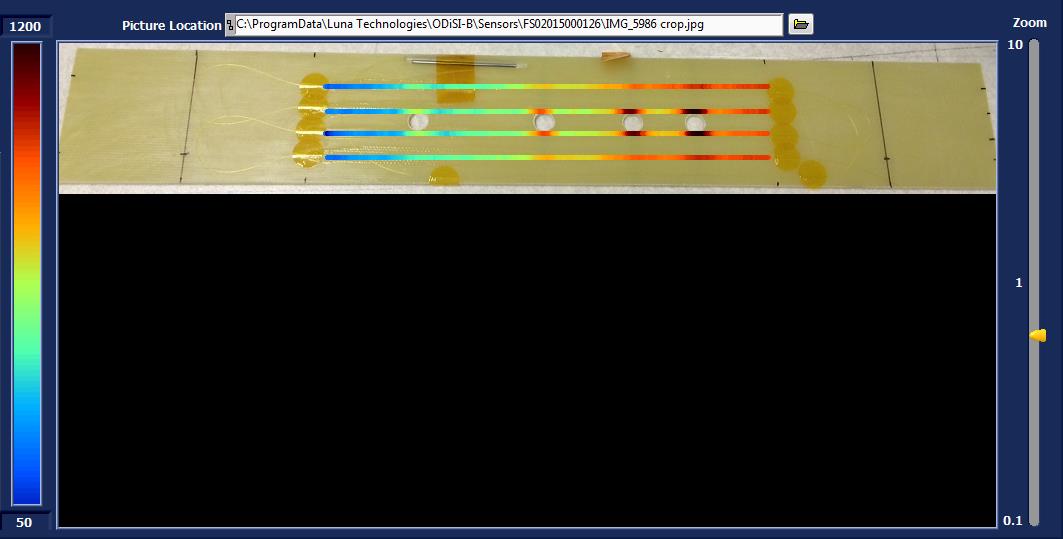
2D color coded visualization of strain
 Simplifying the visualization
To simplify the understanding of critical points within structures or equipment, a graphical image can be imported into the ODiSI user software and strain (or temperature) data mapped to the image.
Â
Â
Â
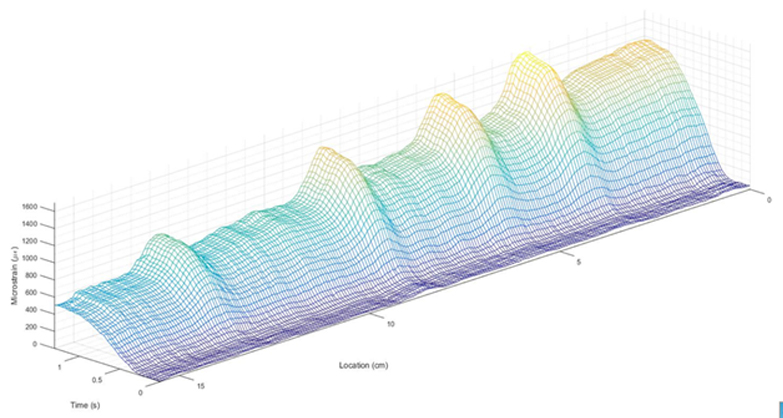
Exporting high definition data
 Mapping the contour of strain or temperature
High definition data can be exported and used to create fully contoured strain or temperature maps. The data at left is a strain map from one of the four sensor runs. The data shows the value of strain from zero deflection to maximum deflection. Clearly visible are the four strain peaks associated with the four machined holes in the test article. This type of data gives a full picture of the state of strain (or temperature) concurrent with the transitions of the load state.
Â
